Resources
TrueMeter: AI Energy Agent That Optimizes Utility Bills
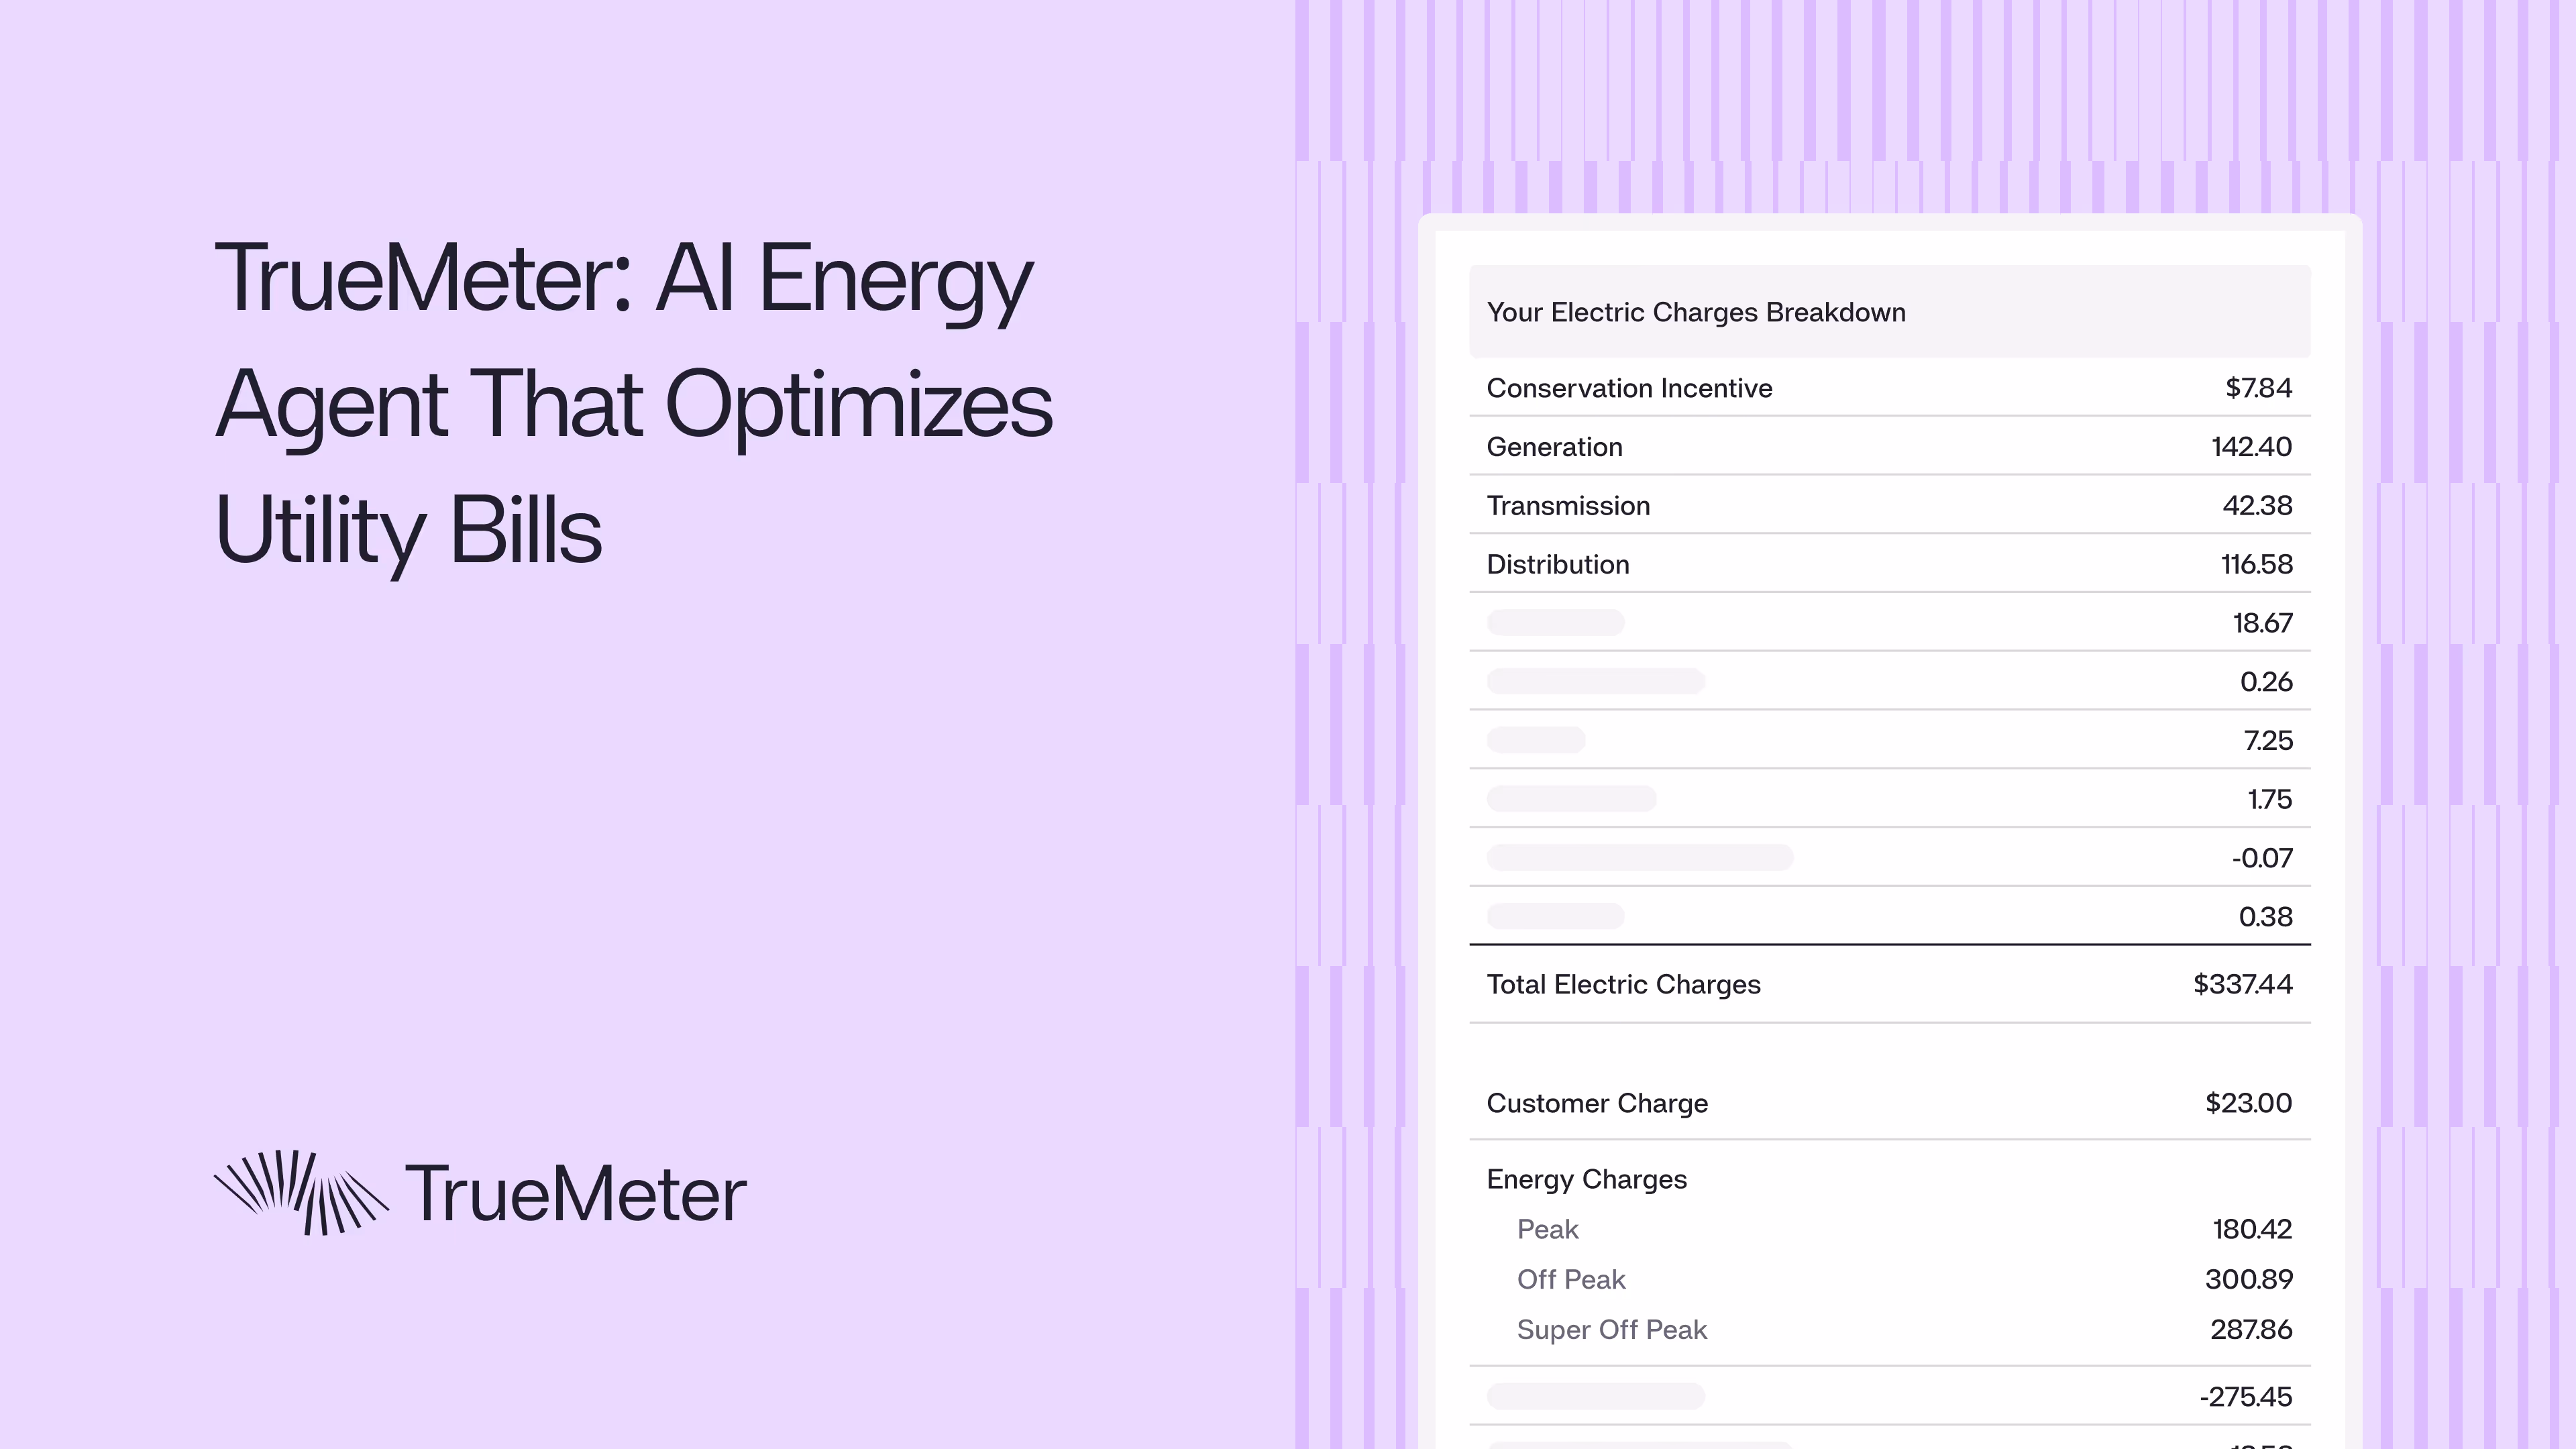
Ever looked at your utility bill? It’s packed with arcane terms: franchise fee surcharge, conservation incentive, electric public purpose, power charge indifference adjustment, on-peak, off-peak, super-off-peak… It might as well be ancient Sumerian. And those are just the line items. Each utility, each energy provider has its own tariffs, schedules, riders, and incentives. Add in the fact that the data comes in inconsistent, non-tabular formats, and parsing it is a nightmare.


Claiming Back $60K+ From One Bill
You’re likely paying more than you should for power. Utility billing often hides overcharges that add up quickly. TrueMeter is an Energy Savings Platform that guarantees savings with no fees or upfront investment. We audit your bills every month so you don’t have to, and in this article we’ll show how one customer was charged far more than they should have been—and how we caught it.
.png)
Gas Procurement Options for Operators: What are the possibilities?
For many CFOs, natural gas procurement raises more questions than answers: Do we really have options beyond the utility? How do independent suppliers fit into the picture? And what rules apply in our state? In fact, in more places than you might expect, competitive energy markets give businesses a genuine choice—each with its own financial and regulatory implications. The challenge is turning that complexity into clarity. That’s where TrueMeter comes in, taking the burden off your plate while ensuring compliance, competitive pricing, and smarter energy decisions. We exist to lower your utility bills.
Ordering New Electric and Gas Meters Costs and Timelines for Multi-Unit Operators Opening New Locations
Introduction If you’re remodeling, opening a new location, or setting up new utility services, you may need to order electric and gas meters. This is a common requirement for restaurant operators, property managers, and contractors. The process can take six months or more, with average costs of around $4,500. At TrueMeter, we’ve guided many customers through this process, and here’s what you can expect along the way.
Operational Insights Hiding in Your Utility Bills: Stolen Power, Misclassification, and Hundreds of Thousands in Utility Losses
Utility bills are supposed to be boring—a monthly cost of doing business. But for multi-location operators, those bills hide something else: a trove of operational data that can reveal theft, errors, inefficiencies, and avoidable costs. Too often, this data goes unseen. Finance teams focus on paying invoices, not analyzing them. Operators focus on running stores, not interrogating kilowatt hours. The result? Businesses routinely miss opportunities to reclaim cash, prevent fraud, and optimize performance. At TrueMeter, we believe utility bills aren’t just expenses—they’re insight engines. By analyzing usage patterns at the minute, hour, and store level, we uncover operational red flags that directly impact the bottom line.